State of the Family by Race
The United States Family Belonging Index is 46 percent, with a corresponding Family Rejection Index of 54 percent, based on 2008-2012 data from the U.S. Census Bureau’s American Community Survey.1) The action of parents determines the Family Belonging or Rejection Index within a nation, region, state, or racial or ethnic group—whether they marry and belong to each other, or whether they reject one another through divorce or other means. Rejection leaves children without married parents committed to one another and to their children.
The Index of Family Belonging is determined by the fraction of children aged 15 to 17 in a given area who live with both their biological parents, who have been married since before or around the time of their birth.
1. Index of Belonging and Rejection by Race
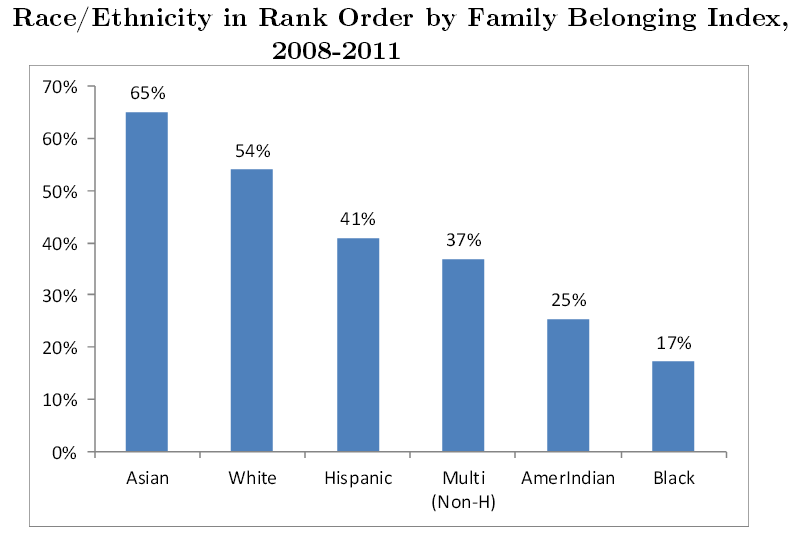
Teenagers from different racial and ethnic groups in the United States have markedly different family experiences. Growing up in an intact family married is over three times less common among Black teenagers than among Asian teenagers.
Sixty-five percent of Asian children in the U.S. aged 15 to 17 were raised with both married biological parents, as were 54 percent of White children aged 15 to 17. The Family Belonging Index among Asians and Whites is, thus, higher than the national average.
By contrast, the Family Belonging Index among Hispanics, Multiracial (non-Hispanic) children, American Indians, and Blacks is lower than the national average. Approximately 41 percent of Hispanic children aged 15 to 17 were raised with both married biological parents. Worse yet, 37 percent of Multiracial teenagers, 25 percent of American Indian teenagers, and a mere 17 percent of Black teenagers were raised in an intact married family.
2. State Index of Belonging by Race
2.1 Asians
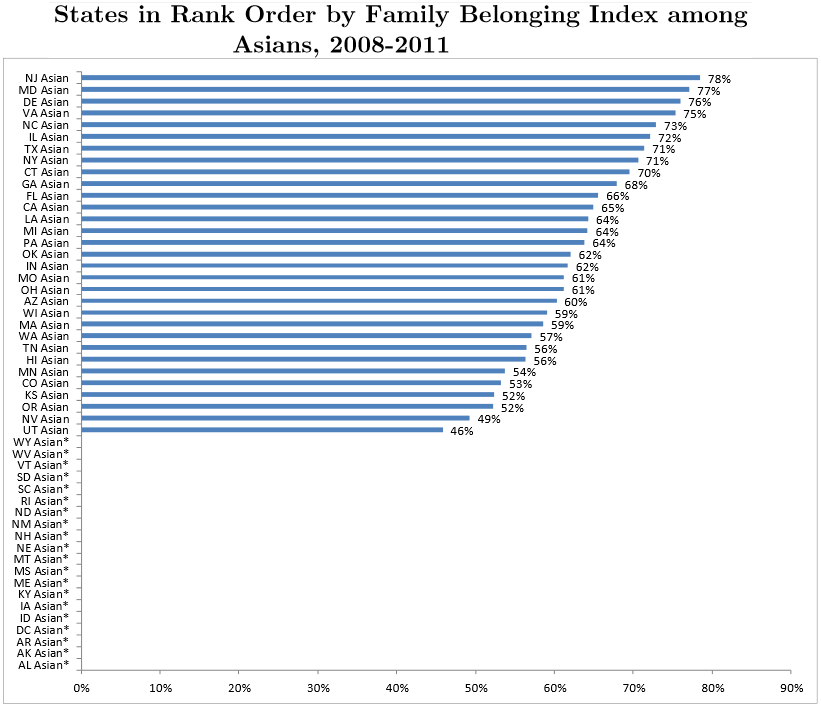
In nearly all states with a large enough Asian population to analyze, the majority of Asian children reach late adolescence in an intact married family. Note that in every state where the Asian population’s family intactness is large enough to analyze, it is equal to or higher than the national Family Belonging Index. The starred states have Asian populations too small to analyze their family intactness.
New Jersey ranks highest in family belonging among Asians: New Jersey leads the nation in family intactness among Asians with a Family Belonging Index among Asians of 78 percent, followed by Maryland, with a Family Belonging Index among Asians of 77 percent, and Delaware, with a Family Belonging Index among Asians of 76 percent.
Utah ranks lowest in family belonging among Asians: Utah enjoys the least family intactness among Asians with a Family Belonging Index among Asians of 46 percent. Nevada has the next-lowest degree of family intactness among Asians, with a Family Belonging Index among Asians of 49 percent, and Oregon and Kansas have the third-lowest, with Family Belonging Indices among Asians of 52 percent.
2.2 Whites
In approximately two thirds of American states, the majority of White children aged 15 to 17 were raised in an intact married family.
New Jersey ranks highest in family belonging among Whites: New Jersey leads the nation in family intactness among Whites with a Family Belonging Index among Whites of 68 percent. The District of Columbia—whose overall Family Belonging Index and Family Belonging Indices among Blacks and Hispanics are abysmally low—has the next-highest Family Belonging Index among Whites, 67 per-cent. New York has the third-highest Family Belonging Index among Whites, 63 per-cent.
Nevada and West Virginia rank lowest in family belonging among Whites: Nevada and West Virginia enjoy the least family intactness among Whites, with Family Belonging Indices among Whites of 42 percent. Arkansas has the next-lowest degree of family intactness, with a Family Belonging Index among Whites of 43 percent.

2.3 Hispanics
In all but two states with a large enough Hispanic population to analyze, the majority of Hispanic children reach late adolescence in a non-intact family. Note that the starred states have Hispanic populations too small to analyze their family intactness.
Idaho ranks highest in family belonging among Hispanics: Idaho leads in family intactness among Hispanics with a Family Belonging Index among Hispanics of 51 percent, followed by Illinois, with a Family Belonging Index among Hispanics of 50 percent, and Alabama, with a Family Belonging Index among Hispanics of 49 percent.
The District of Columbia ranks lowest in family belonging among Hispanics: Family intactness is lowest among Hispanics in the District of Columbia, which has the lowest average Family Belonging Index of any state in the nation. Among Hispanics, the Family Belonging Index in the District of Columbia is 18 percent. Massachusetts has the next-lowest degree of family intactness among Hispanics, with a Family Belonging Index among Hispanics of 21 percent, followed by Rhode Island, with a Family Belonging Index among Hispanics of 25 percent.

2.4 Multicultural
In all but one state with a large enough Multiracial (non-Hispanic) population to ana-lyze, the majority of Multiracial children aged 15 to 17 were raised in a non-intact family. Note that the starred states have Multiracial populations too small to analyze their family intactness.
Utah ranks highest in family belonging among Multiracial teenagers: Utah leads in family intactness among Multiracial teenagers with a Family Belonging Index among Multiracial teenagers of 54 percent, followed by New Jersey, with a Family Belonging Index among Multiracial teenagers of 48 percent, and Hawaii and California, with Family Belonging Indices among Multiracial teenagers of 46 percent.
Iowa ranks lowest in family belonging among Multiracial teenagers: Family intactness is lowest among Multiracial teenagers in Iowa, with a Family Belonging Index among Multiracial teenagers of 21 percent. Wisconsin has the next-lowest degree of family intactness among Multiracial teenagers, with a Family Belonging Index among Multiracial teenagers of 23 percent, followed by Ohio, Indiana, Mississippi, and Kentucky, at 25 percent.

2.5 American Indians
In all states with a large enough American Indian population to analyze, only a minority of American Indian children aged 15 to 17 were raised in an intact married family. Note that the starred states have American Indian populations too small to analyze their family intactness.
New York ranks highest in family belonging among American Indians: New York leads in family intactness among American Indians with a Family Belonging Index among American Indians of only 38 percent, followed by Oklahoma and Texas, with Family Belonging Indices among American Indians of 37 percent.
Washington ranks lowest in family belonging among American Indians: Family intactness is lowest among American Indians in Washington, with a Family Belonging Index among American Indians of 12 percent. North Dakota has the next-lowest degree of family intactness among American Indians, with a Family Belonging Index among American Indians of 15 percent, followed by South Dakota, with a Family Belonging Index among American Indians of 17 percent.

2.6 Blacks
In all states with a large enough Black population to analyze, about one quarter or less of Black children aged 15 to 17 were raised in an intact married family. The starred states have Black populations too small to analyze their family intactness.
Nebraska ranks highest in family belonging among Blacks: Nebraska leads in family intactness among Blacks with a Family Belonging Index among Blacks of only 26 percent, followed by Virginia, with a Family Belonging Index among Blacks of 23 percent, and Massachusetts, Delaware, and Maryland, with Family Belonging Indices among Blacks of 21 percent.
Wisconsin ranks lowest in family belonging among Blacks: Family intactness is lowest among Blacks in Wisconsin, with a Family Belonging Index among Blacks of only 7 percent. The District of Columbia, which has the lowest average Family Belonging Index in the United States, has the next-lowest degree of family intactness among Blacks, with a Family Belonging Index among Blacks of 9 percent, followed by Missouri and New Mexico, with Family Belonging Indices among Blacks of 10 percent.

This entry draws heavily from Fourth Annual Index of Family Belonging and Rejection.